AWS Developer Tools Services Part 3: AWS CodeDeploy
Introduction
This post is part of my mini-series about AWS Developer Tools Services
- Part 1: AWS CodeCommit
- Part 2: AWS CodeBuild
- Part 3: AWS CodeDeploy
- Part 4: AWS CodePipeline
![]()
AWS CodeDeploy
CodeDeploy is a flexible deployment service that can integrate with a number of different services. It can deploy to EC2/On-premises instances as well as AWS Lambda and Amazon ECS. In my example I’ll use EC2 deployment on a Windows server.
Agent
CodeDeploy requires an agent application installed on the target machines. This is only a requirement for EC2 though. For containers (ECS) and serverless (Lambda) deployments this is not necessary.
As of this writing it’s officially supported by the following versions of Windows Server: 2016, 2012 R2, and 2008 R2.
The installer for the agent program can be downloaded from here
The agent setup is a bit unintuitive in the sense that once it’s done it just disappears without any confirmation of successful installation.

Creating an Application
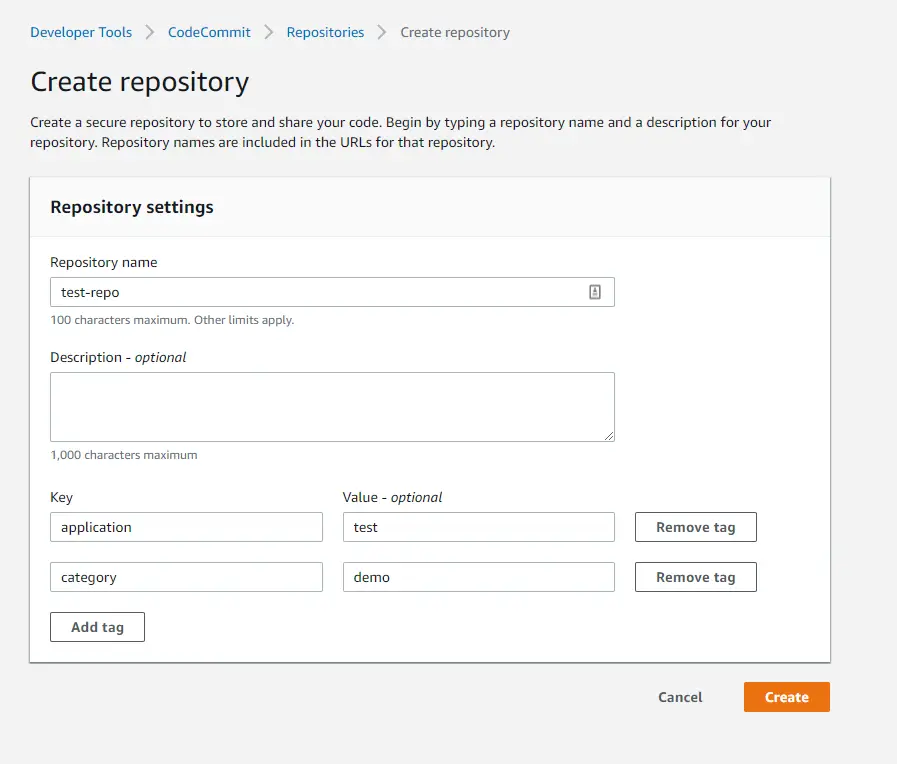
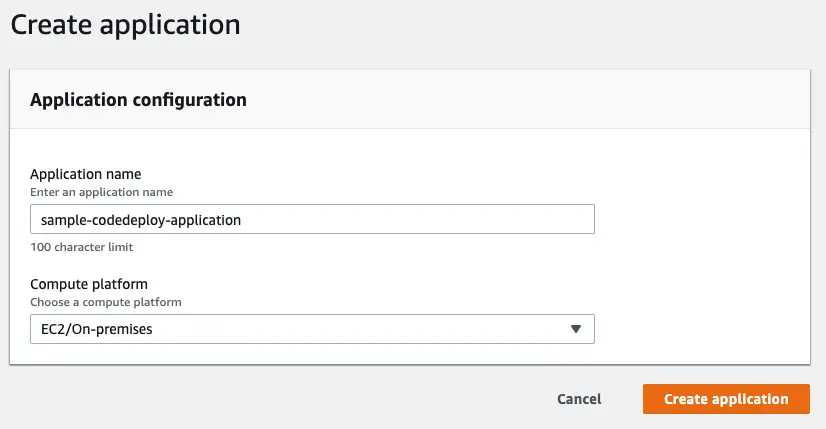
Now that we have the EC2 instance running with the CodeDeploy agent we are ready to configure CodeDeploy service.
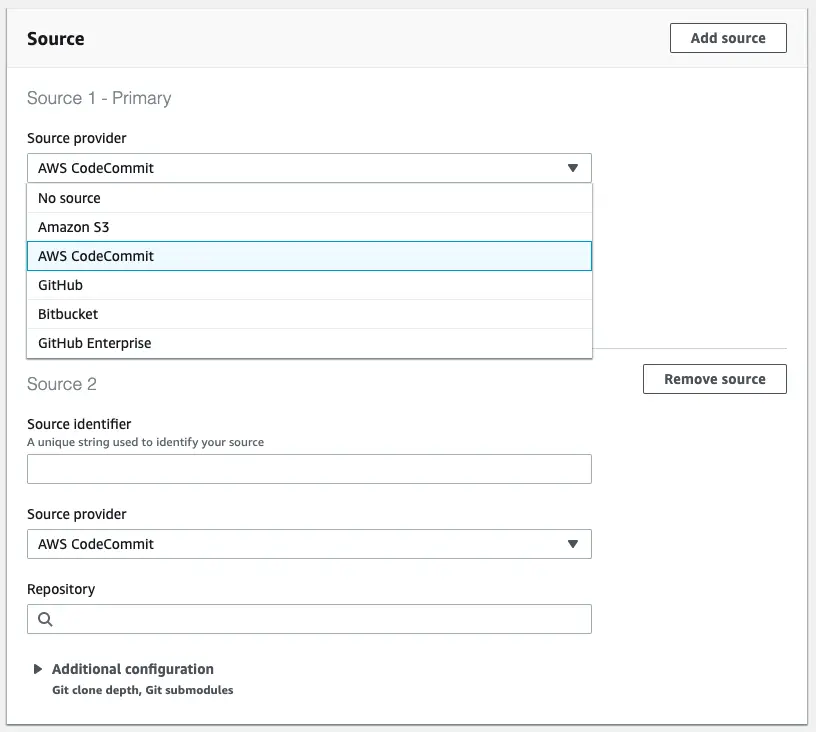
First we need to create our application and specify the target platform (EC2 / ECS / Lambda).
Create a Deployment Group
In order to create a deployment group we need to supply a few details.
IAM Role
We need to provide a CodeDeploy service role. So first we need go to IAM, create a role and select CodeDeploy from the AWS Services list. Then select the use case (in my case it’s the first option):
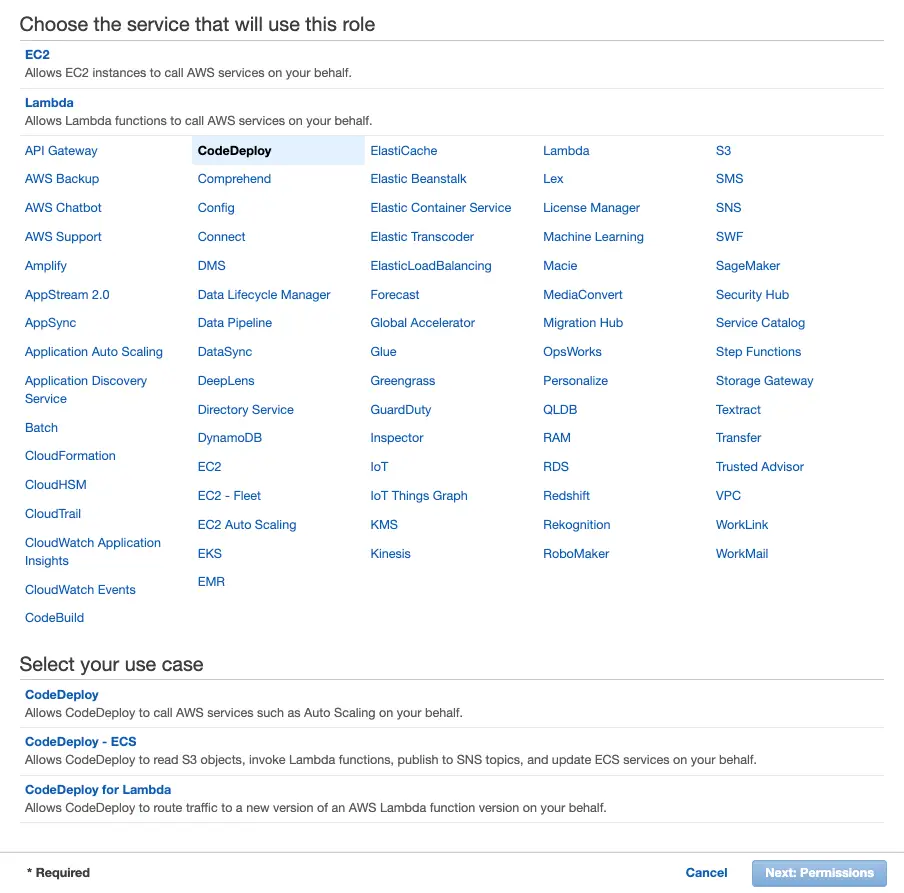
This comes with a role with AWSCodeDeployRole policy attached.
Finally we give it a name and copy the ARN and use it in CodeDeploy configuration.
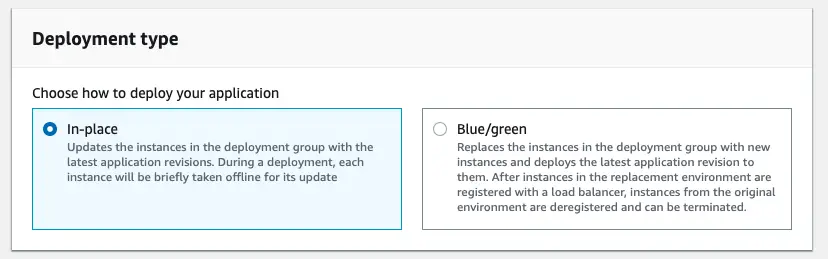
Deployment Type
CodeDeploy supports 2 types of deployment:
- In-place
- Blue/green
In this example I will have 1 EC2 instance and I will use In-place deployment type. But Blue/green is very important to have a new system with no downtime so I’ll cover that bit in a separate post.
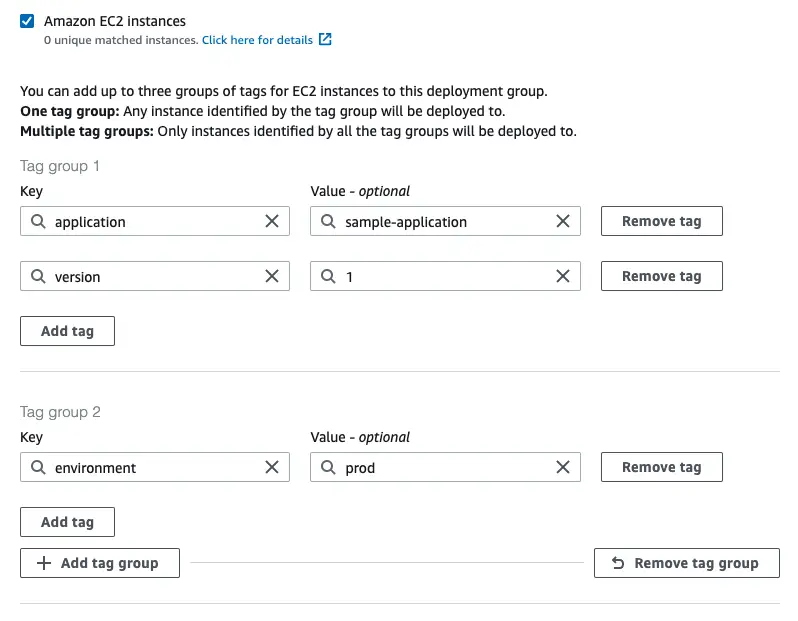
Environment Configuration
The way CodeDeploy finds the target instances is via tags. You can provide multiple groups of tags. In that case, for an instance to be targeted by CodeDeploy
Other Settings
There are more settings such as deployment configuration (deploy all at once, one at a time, half at a time) and configuring Load Balancer. Since I’m only covering the basics in this example I’ll not explore those features. They don’t mean much with a single EC2 instance anyway.
Deploying the Application
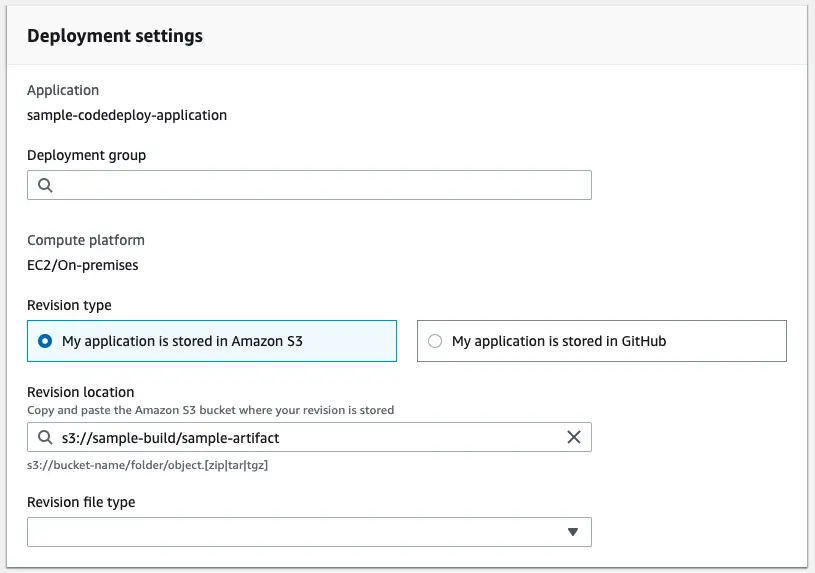
We have at this point defined the target of the deployment and now we need to define what to deploy.
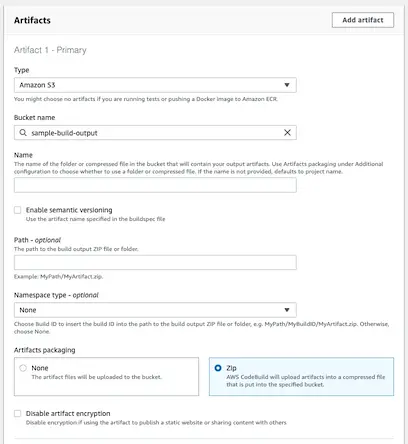
To tie it to the previous configuration we have done, we first select the deployment group. Then we choose the location of the deployment package: In my example I’ll use the artifacts built by CodeBuild and uploaded to Amazon S3.
After you create the deployment, it automatically starts it. Make sure there are running instances with the correct tags other wise you might see an error like this:

For each deployment you need to create a new deployment. The good news is that you can an existing deployment and create it very quickly that way.
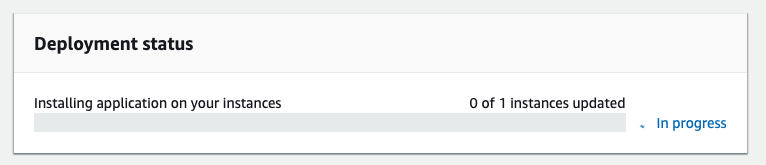
After the deployment starts on the instances you can see the progress on the screen right away:
IAM Instance Profile
If you are having an error like this
InstanceAgent::Plugins::CodeDeployPlugin::CommandPoller: Missing credentials - please check if this instance was started with an IAM instance profile
that is probably because you skipped creating an instance profile for your EC2 instances like I did. It is explained here.
Basically the CodeDeploy agent running in EC2 instance needs to communicate with CodeDeploy service and Amazon S3 to get the deployment package.
To resolve this issue:
- Create an IAM policy like this:
{
  "Version": "2012-10-17",
  "Statement": [
    {
      "Effect": "Allow",
      "Action": [
        "s3:Get*",
        "s3:List*"
      ],
      "Resource": [
        "arn:aws:s3:::replace-with-your-s3-bucket-name/*",
        "arn:aws:s3:::aws-codedeploy-us-east-1/*"
      ]
    }
  ]
}
- Create an IAM service role for EC2. In permissions, attach the policy created in Step 1.
In EC2, select the instance and attach the role:
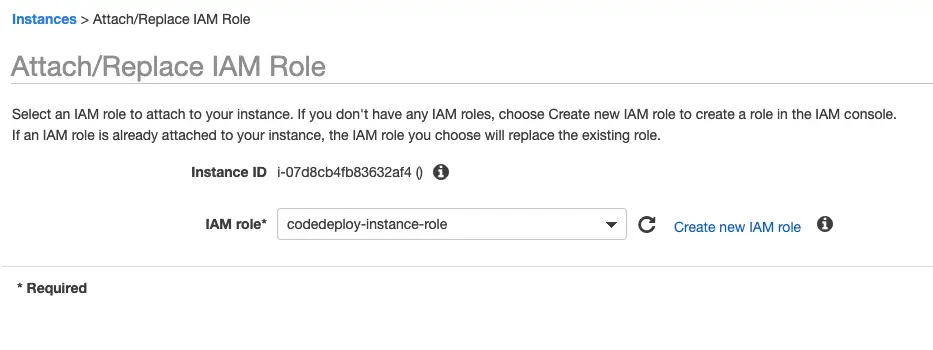
Make sure to restart the service after attaching the role.
AppSpec.yml
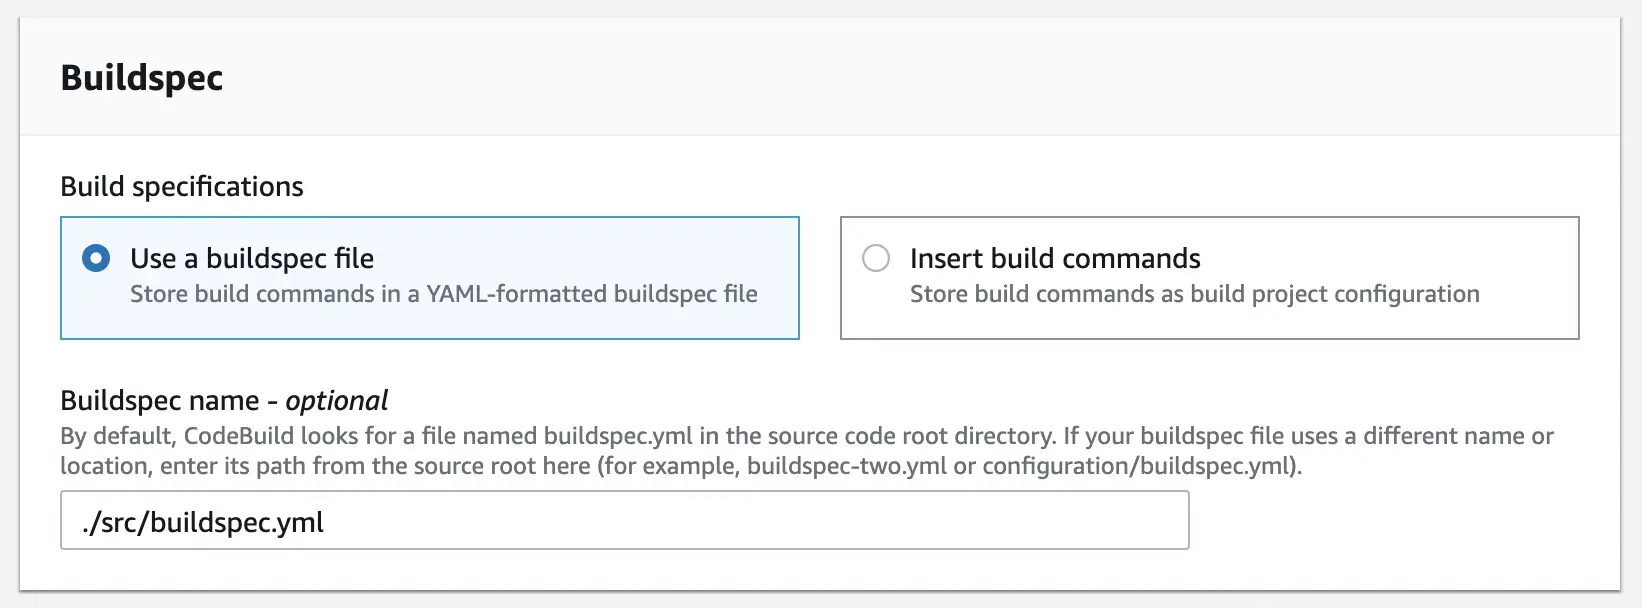
At this point the agent can locate the deployment package but it doesn’t know what to do with. We need to define installation steps. Just like we had to provide a buildspec.yml file to CodeBuild service, we need to provide an appspec.yml file to CodeDeploy service to define these deployment steps.
appspec.yml file must be placed in application source code’s root folder.
In this example, the deployment is basically just copying the new application to the destination and my appspec.yml file looks like this:
version: 0.0
os: windows
files:
  - source: \
    destination: c:\website
In addition to this basic configuration, it’s possible to run scripts before and after installation. So if there are dependencies or clean up tasks they can be carried out that way.
Troubleshooting
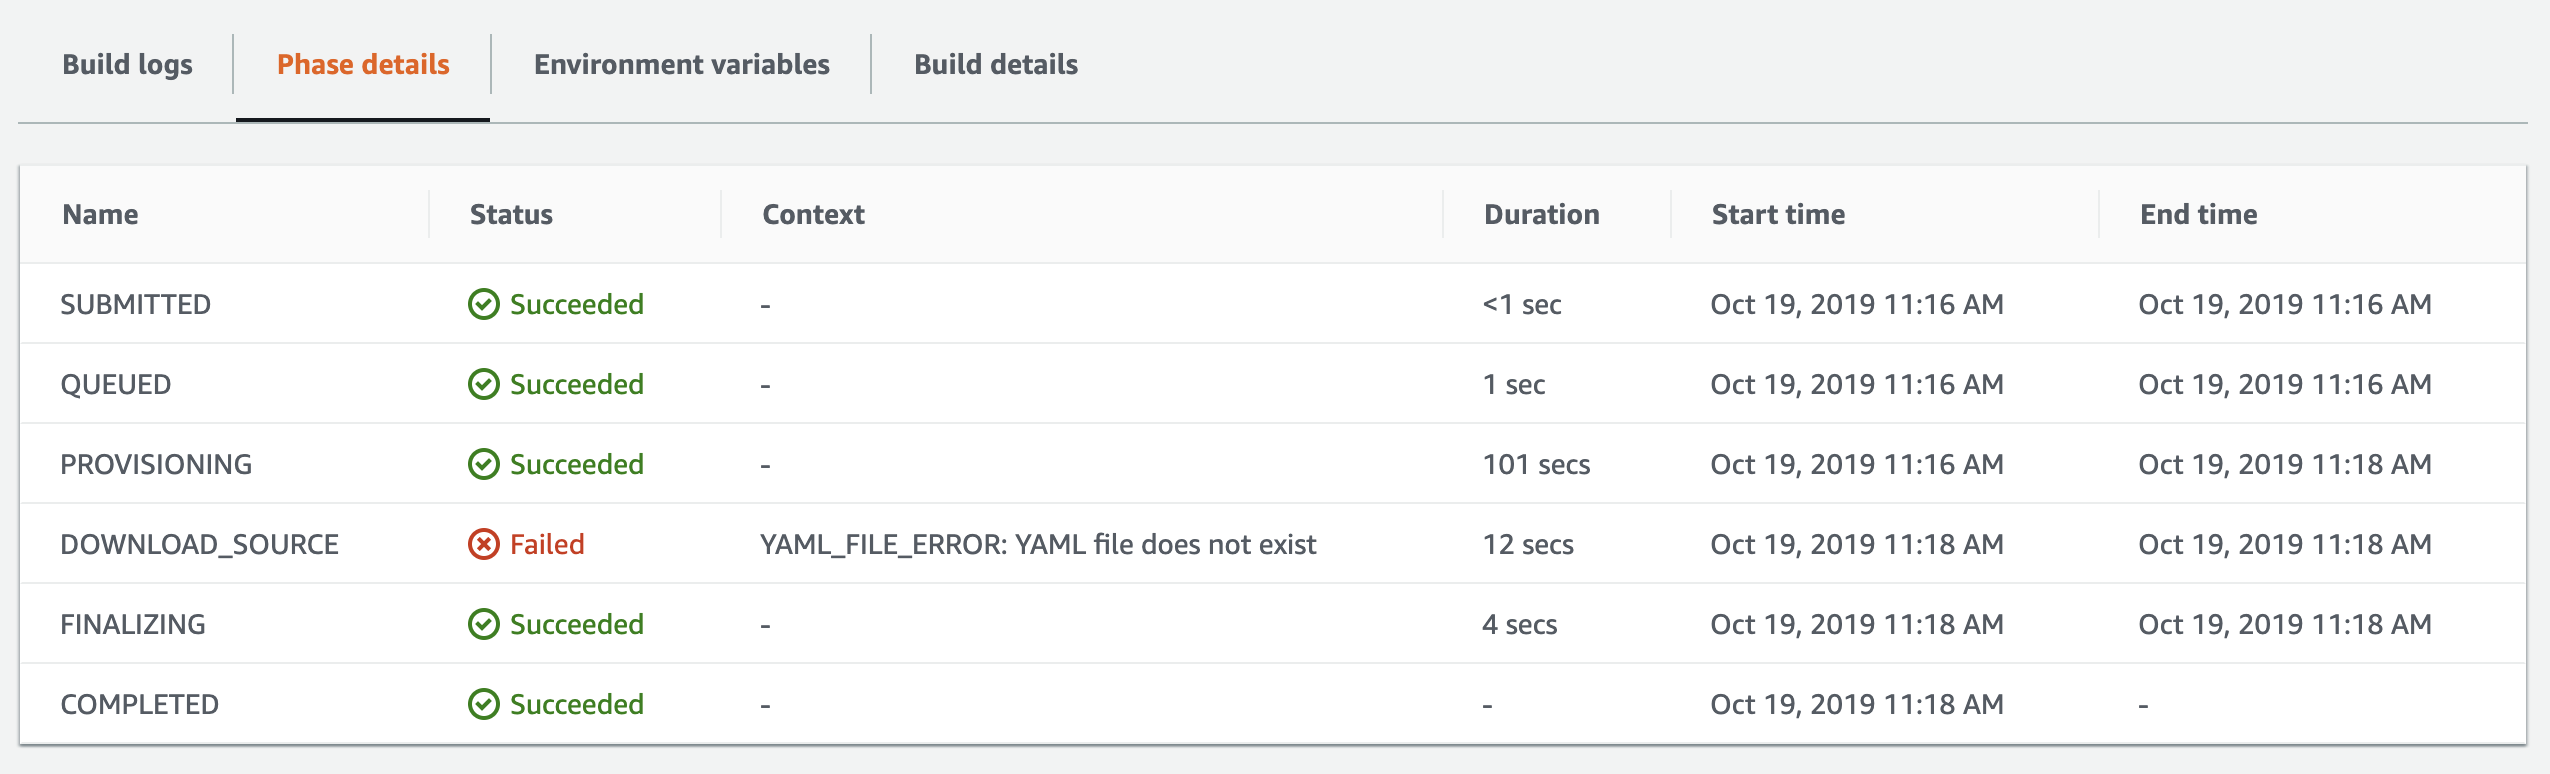
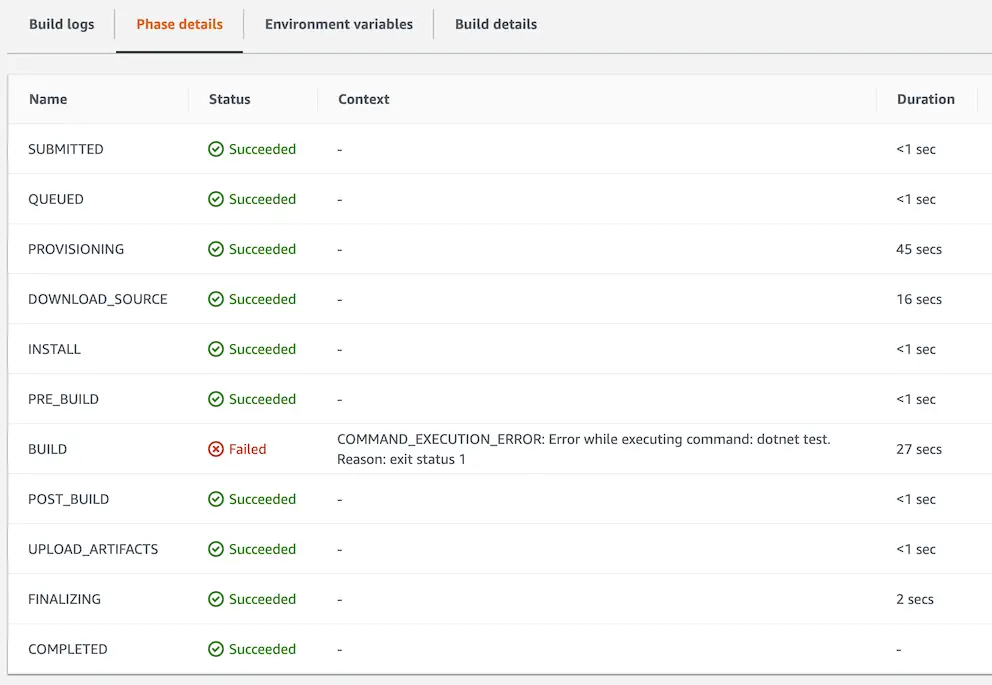
I created this sample project on a MacBook Pro and when I tested the deployment had the following error:

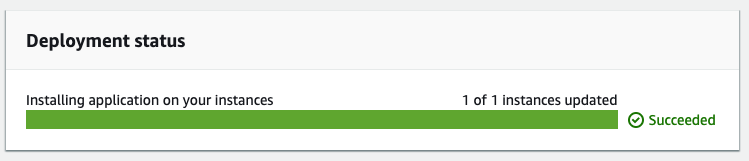
The problem is the line endings. Windows expects \r\n line endings whereas on unix-baseds systems the line ending is \n. So the solution for that is to save the appsepc.yml file with UTF-8 encoding and the agent was able to read the file correctly and automatically unzips the contents of the deployment package to the target folder:
Conclusion
In this post I used basic features of AWS CodeDeploy service to deploy my artifacts from the previous post and carry out the actual deployment. In future posts I will focus on more advanced features and other AWS code services.