Design Patterns: Abstract Factory
A few days ago I published a post discussing Factory Method pattern. This article is about the other factory design pattern: Abstract Factory.
Use case: Switching between configuration sources easily
Imagine in a C# application you accessed ConfigurationManager.AppSettings whenever you needed a value from the configuration. This would essentially be hardcoding the configuration source and it would be hard to change if you needed to switch to another configuration source (database, web service, etc). A nicer way would be to “outsource” the creation of configuration source to another class.
What is Abstract Factory?
Here’s the official definition from GoF:
Provide an interface for creating families of related or dependent objects without specifying their concrete classes.
Implementation
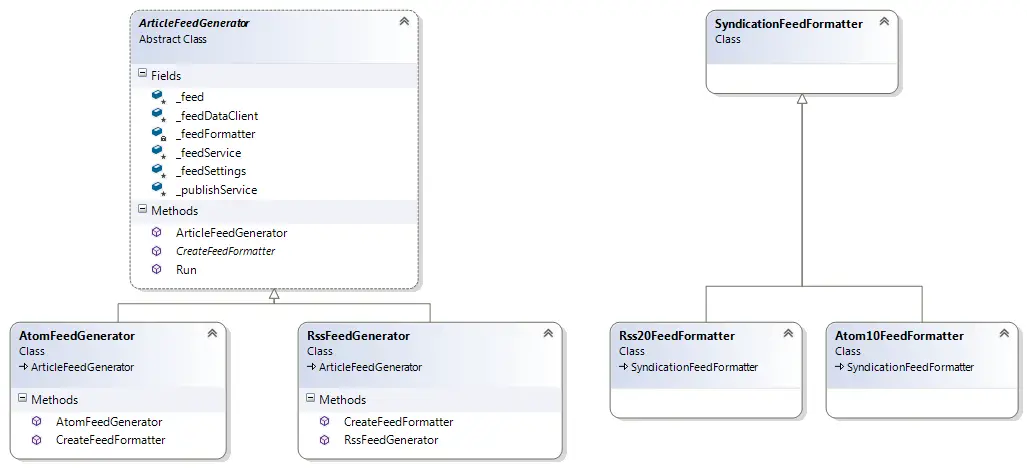
The application first composes the main class (ArticleFeedGenerator) with the services it will use and starts the process.
static void Main(string[] args)
{
    IConfigurationFactory configFactory = new AppConfigConfigurationFactory();

    IApiSettings apiSettings = configFactory.GetApiSettings();
    IFeedSettings feedSettings = configFactory.GetFeedSettings();
    IFeedServiceSettings feedServiceSettings = configFactory.GetFeedServiceSettings();
    IS3PublisherSettings s3PublishSettings = configFactory.GetS3PublisherSettings();
    IOfflineClientSettings offlineClientSettings = configFactory.GetOfflineClientSettings();

    var client = new OfflineClient(offlineClientSettings);
    var articleFeedService = new ArticleFeedService(feedServiceSettings);
    var publishService = new S3PublishService(s3PublishSettings, feedSettings);
    var feedGenerator = new ArticleFeedGenerator(client, articleFeedService, publishService, feedSettings);

    feedGenerator.Run();
}
This version uses AppConfigConfigurationFactory to get the values from the App.config. When I need to switch to DynamoDB which I used in this example all I have to do is replace one line of code in the application:
var configFactory = new DynamoDBConfigurationFactory();
With this change alone we are essentially replacing a whole family of related classes.
On the factory floor
The abstract factory and the concrete factories implement it are shown below:
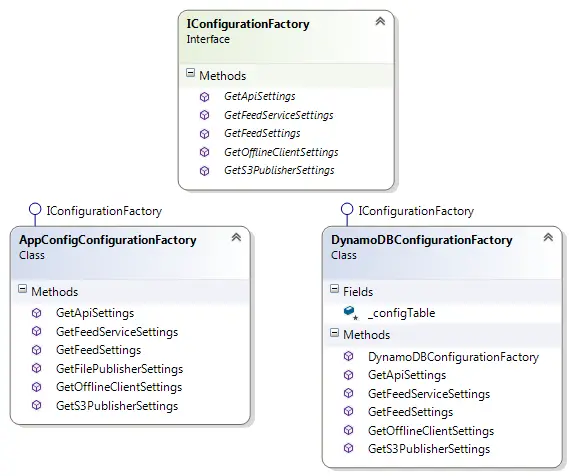
Concrete configuration factories create the classes that deal with specific configuration values (concrete products). For instance AppConfigConfigurationFactory looks like this (simplified for brevity):
public class AppConfigConfigurationFactory : IConfigurationFactory
{
    public IApiSettings GetApiSettings()
    {
        return new AppConfigApiSettings();
    }

    public IFeedServiceSettings GetFeedServiceSettings()
    {
        return new AppConfigFeedServiceSettings();
    }
}
Similarly, DynamoDBConfigurationFactory is responsible for creating concrete classes that access DynamoDB values:
public class DynamoDBConfigurationFactory : IConfigurationFactory
{
    protected Table _configTable;

    public DynamoDBConfigurationFactory()
    {
        AmazonDynamoDBClient dynmamoClient = new AmazonDynamoDBClient("accessKey", "secretKey", RegionEndpoint.EUWest1);
        _configTable = Table.LoadTable(dynmamoClient, "tableName");
    }

    public IApiSettings GetApiSettings()
    {
        return new DynamoDBApiSettings(_configTable);
    }

    public IFeedServiceSettings GetFeedServiceSettings()
    {
        return new DynamoDBFeedServiceSettings(_configTable);
    }
}
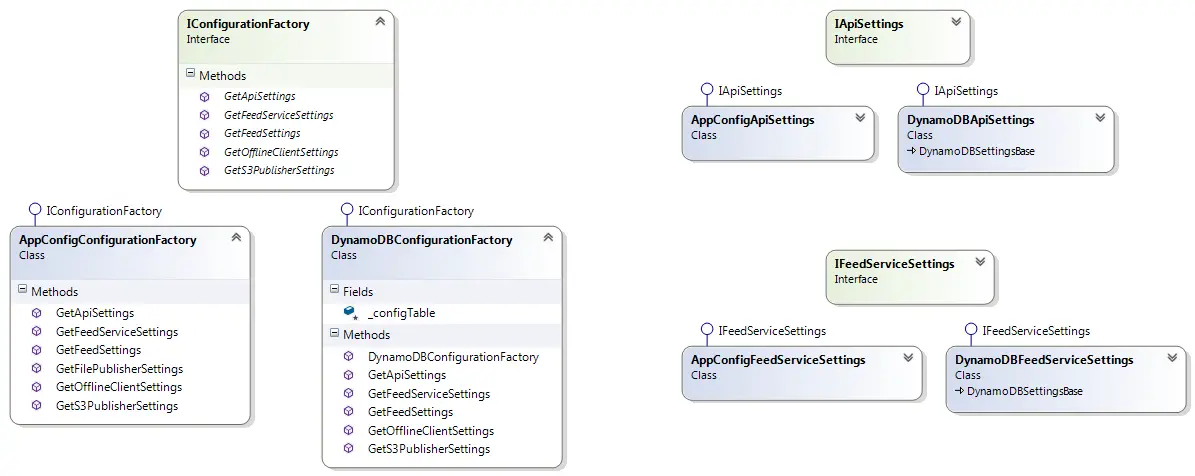
Notice all the “concrete products” implement the same “abstract product” interface and hence they are interchangable. With the product classes in the picture the diagram now looks like this:
Finally let’s have a look at the concrete objects that carry out the actual job. For example the IApiSettings exposes 2 string properties:
public interface IApiSettings
{
    string ApiKey { get; }
    string ApiEndPoint { get; }
}
If we want to read these values from App.config it’s very straightforward:
public class AppConfigApiSettings : IApiSettings
{
    public string ApiKey
    {
        get { return ConfigurationManager.AppSettings["ApiKey"]; }
    }

    public string ApiEndPoint
    {
        get { return ConfigurationManager.AppSettings["ApiEndPoint"]; }
    }
}
The DynamoDB version is fairly more complex but it makes no difference from the consumer’s point of view. Here GetValue is a method in the base class that returns the value from the encapsulated Amazon.DynamoDBv2.DocumentModel.Table object.
public class DynamoDBApiSettings : DynamoDBSettingsBase, IApiSettings
{
    public DynamoDBApiSettings(Table configTable)
        : base (configTable)
    {
    }

    public string ApiKey
    {
        get { return GetValue("ApiKey"); }
    }

    public string ApiEndPoint
    {
        get { return GetValue("ApiEndPoint"); }
    }
}
The concrete factory is responsible for creating the concrete classes it uses. So the client is completely oblivious to the classes such as DynamoDBApiSettings or AppConfigApiSettings. This means we can add a whole new set of configuration classes (i.e. a web service) and all we have to change in the client code will be one line where we instantiate the concrete factory.
This approach also allows us to be more flexible with the concerete class implementations. For example DynamoDB config class family requires a Table object in their constructors. To avoid code repetition I derived them all from a base class and moved the table to the base but the that doesn’t change anything in the client code.