
Visual Tools for Neo4J
It always helps to know the ecosystem to get the maximum performance out of any development platform. In this post I will cover some of the tools that can be used to manage a Neo4J database.
Neo4J Browser
This tool comes out of the box and very handy to run Cypher queries and get visual results. I covered some of the stuff you can do with this tool in an earlier post but it’s capable of much more so very nice tool to have in your toolbelt. I think the only shortcoming is you cannot edit data visually. I think it would be very helpful to have the ability to manually add nodes or create new relationships in a drag & drop fashion. It would save time to write the queries from scratch every time but maybe it can have that feature in the future releases.
Linkurious
This is a paid online service. Unfortunately they don’t have a trial option. You can sign up for an online demo though.
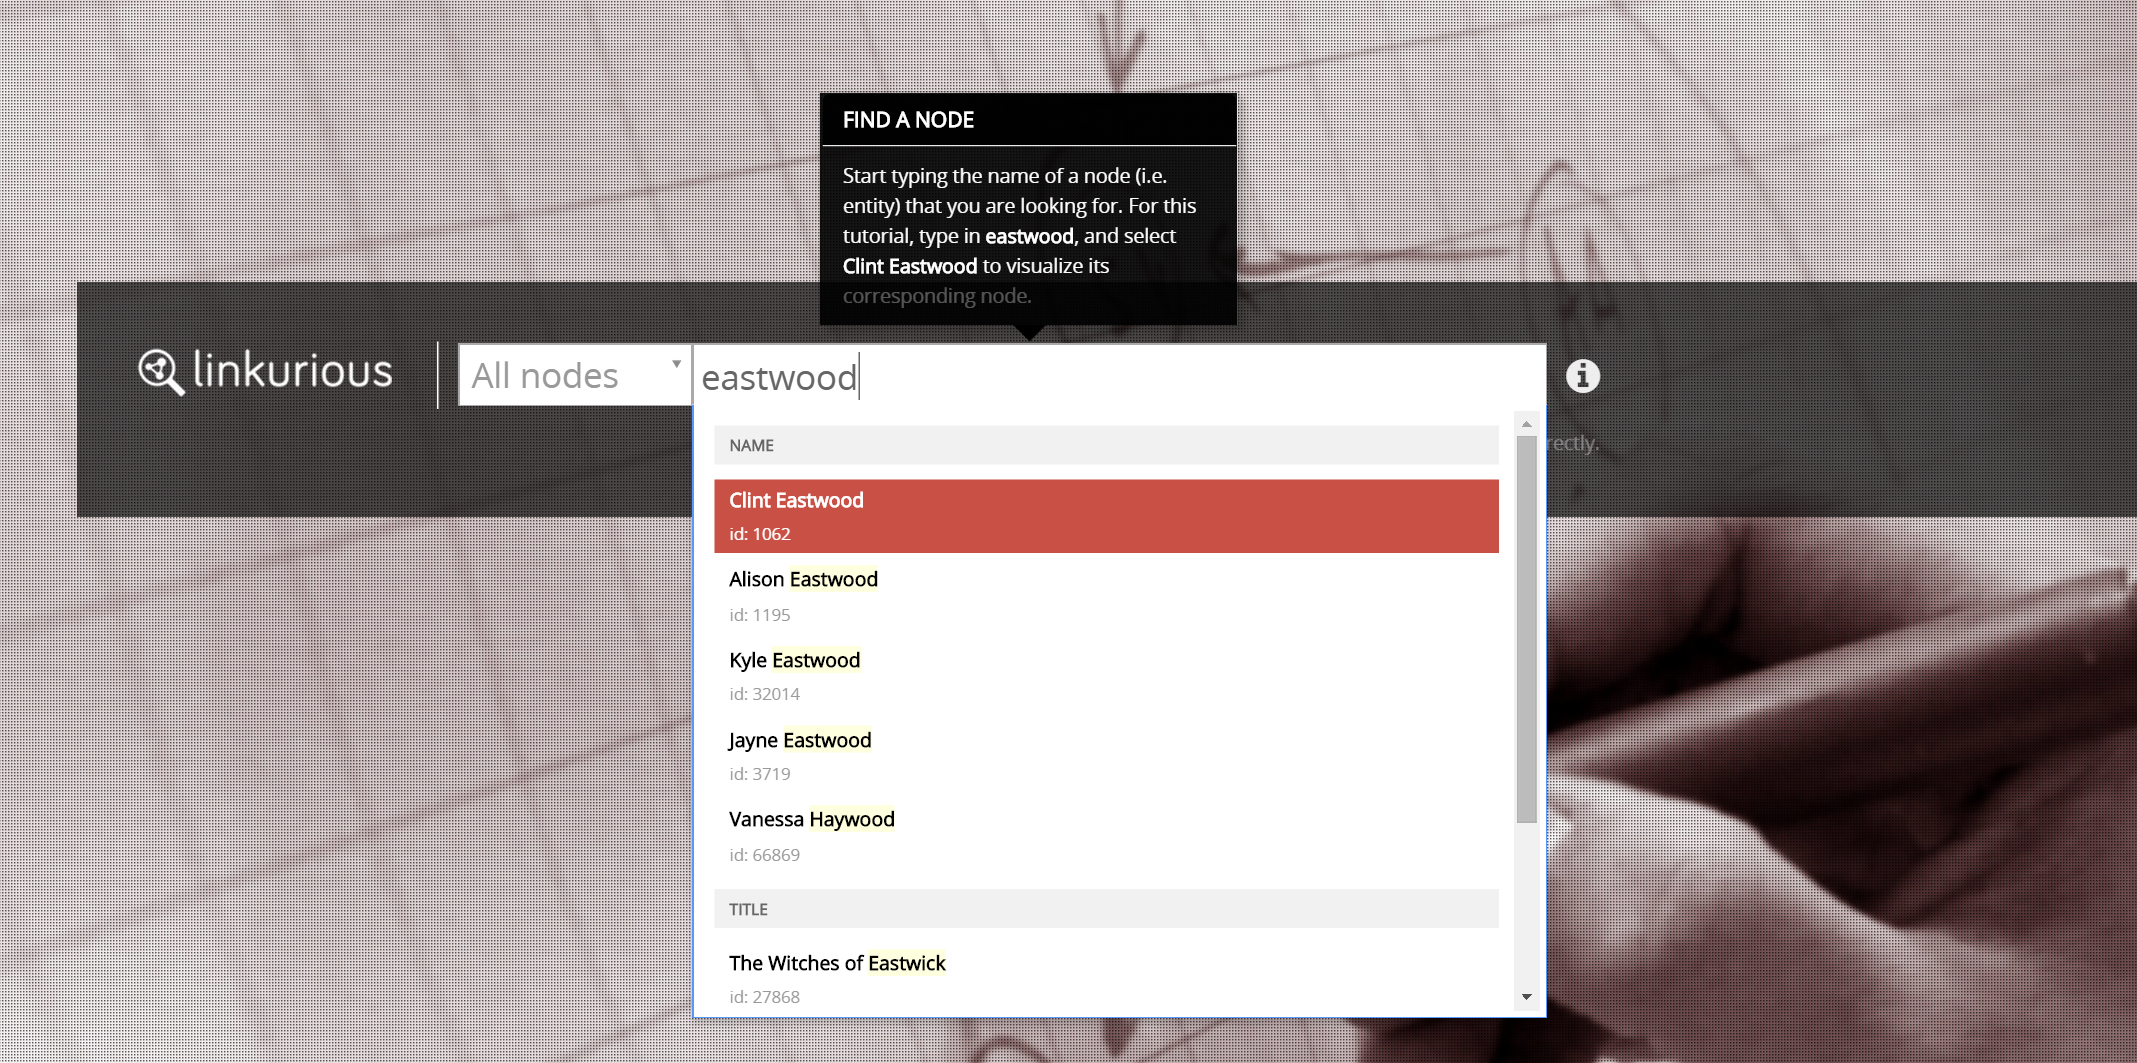
It has a nice intuitive user interface that allows you to search and edit data via the UI.
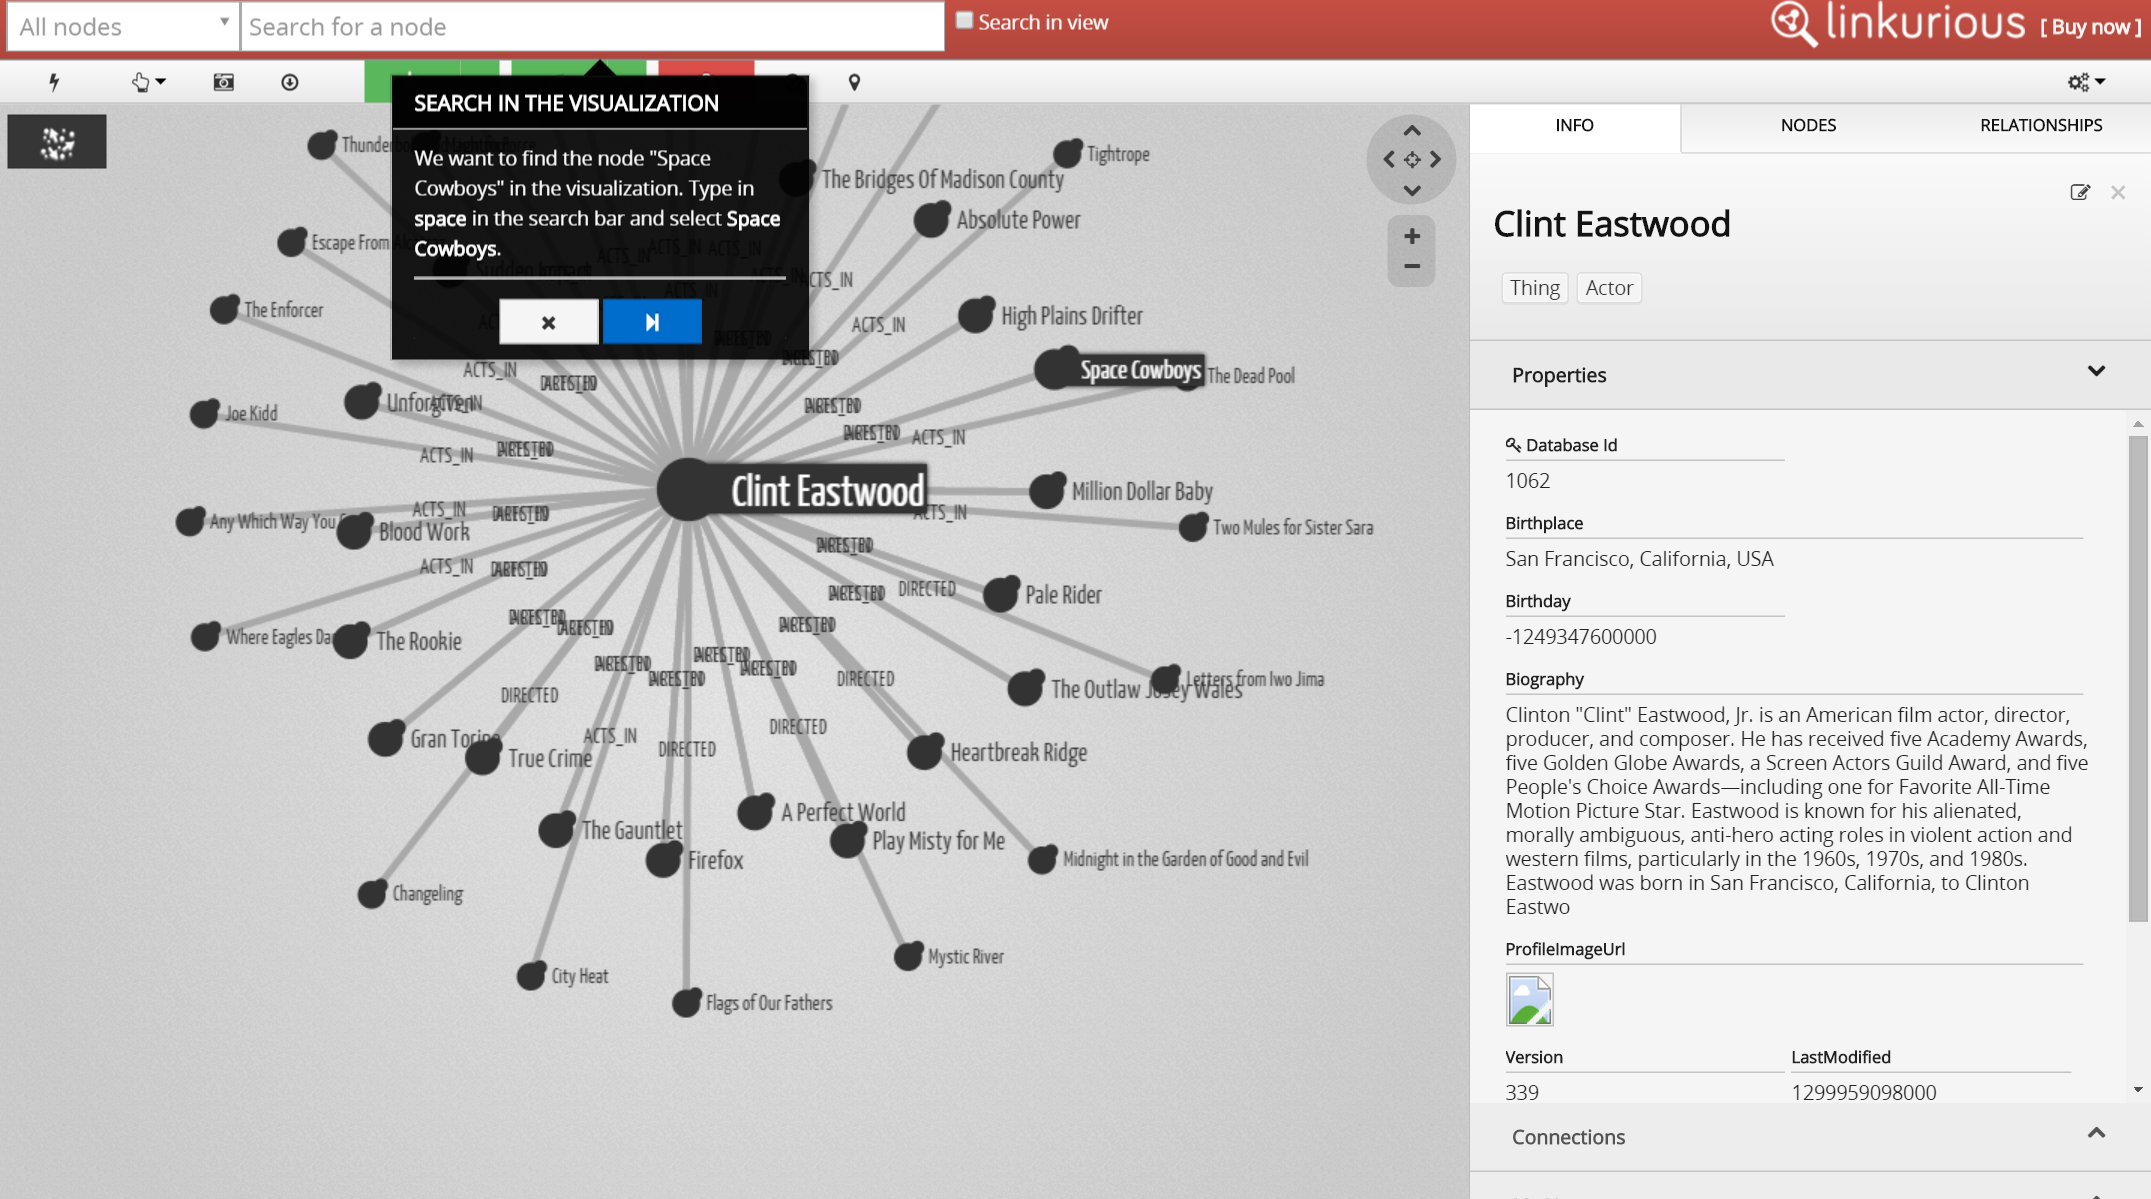
When I tried to edit data or try the “Save as a Neo4J Database” feature I got errors.
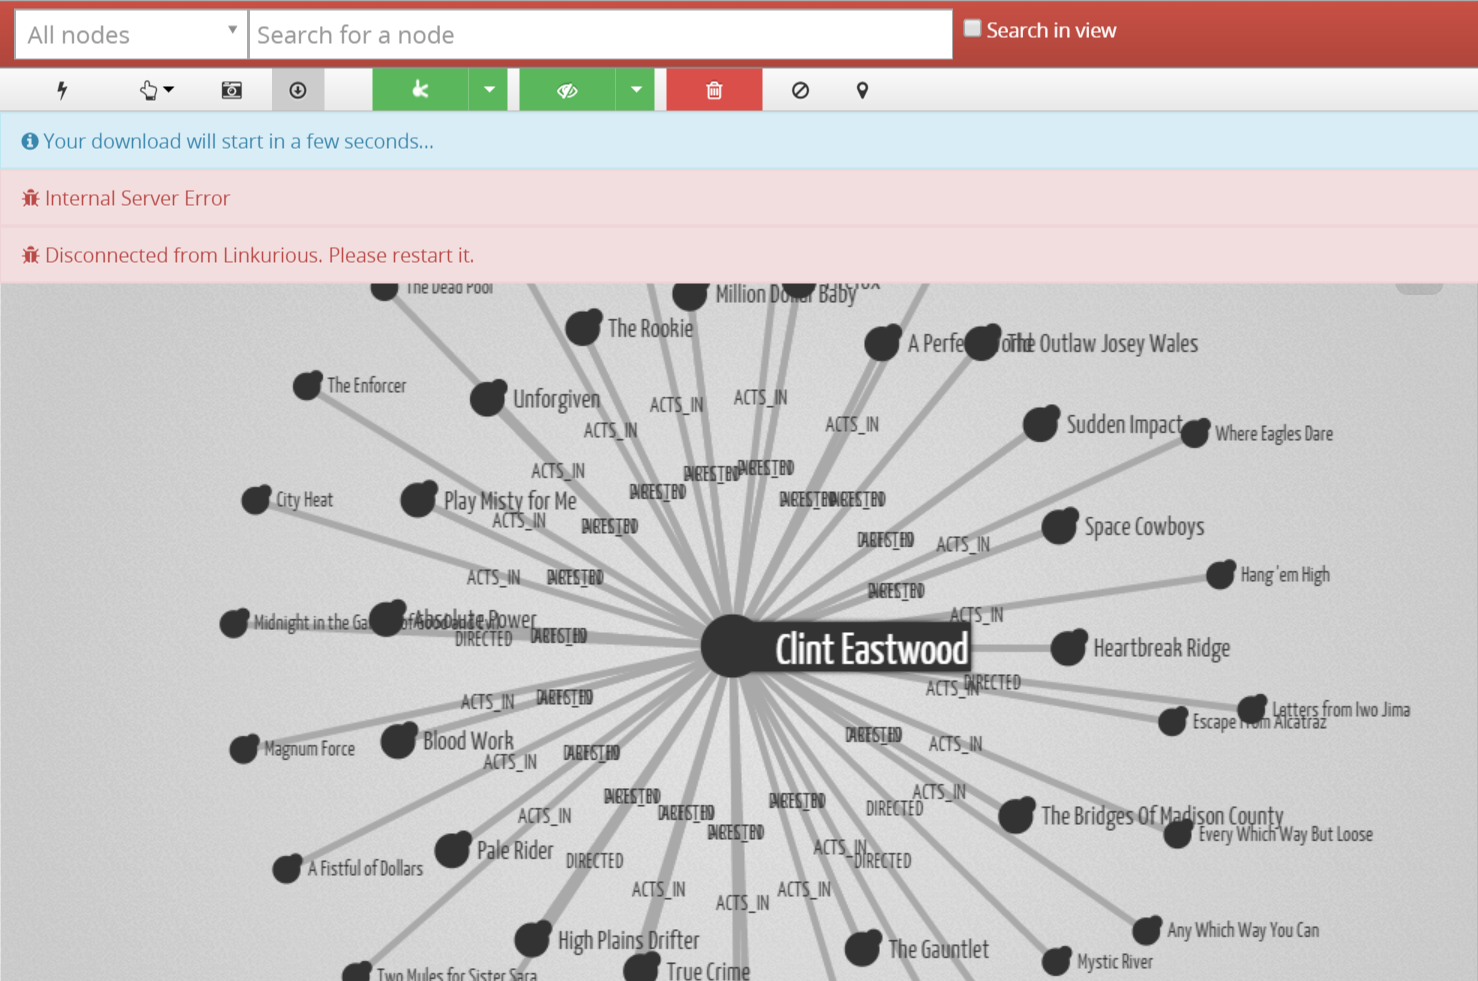
I don’t know if it’s a limitation of the demo version or their system was having a bad day but I’m not convinced to fork over €249 for this tool yet.
UPDATE: After I published this post I’ve been informed that adding/editing feature is disabled in the demo. So the error messages were intentional and not because of a system failure.
Neoclipse
This is a free an open-source desktop application written in Java. It has some flaws (e.g. sometimes you have to reconnect to server to see the affects or your changes) but in general it’s a nice tool for visual editing. You can also run Cyper queries.
Another neat feature to further embellish the visualization is assigning icons to nodes.
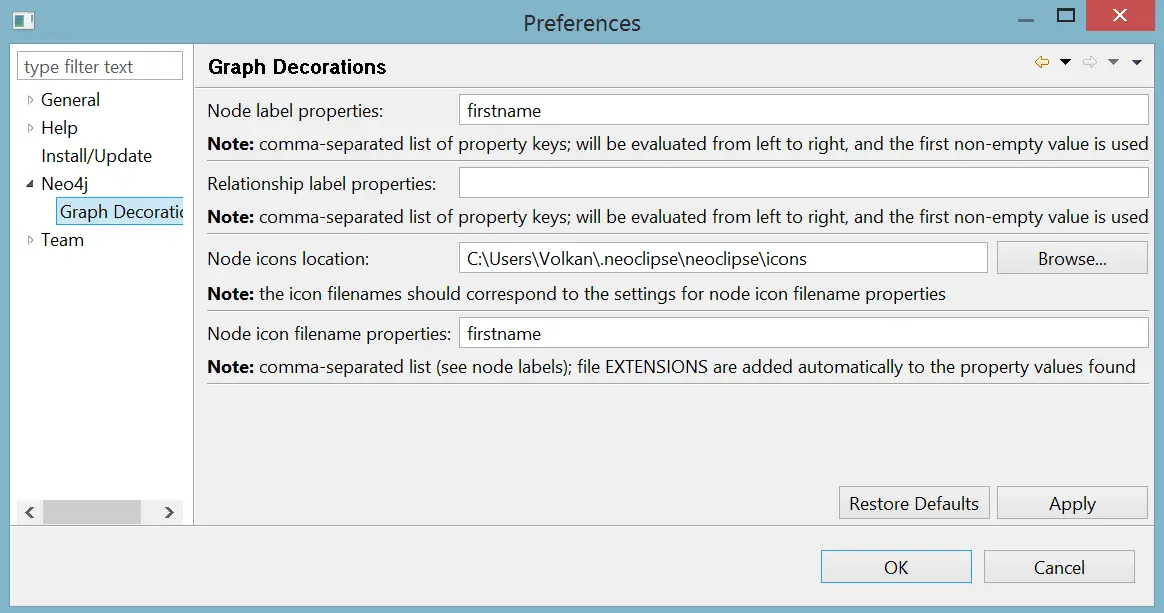
You can specify a folder that contains your images. The image name must match the property specified in the “Node icon filename properties” textbox.
For example when I ran my sample Simpsons Cypher script I get the following graph:
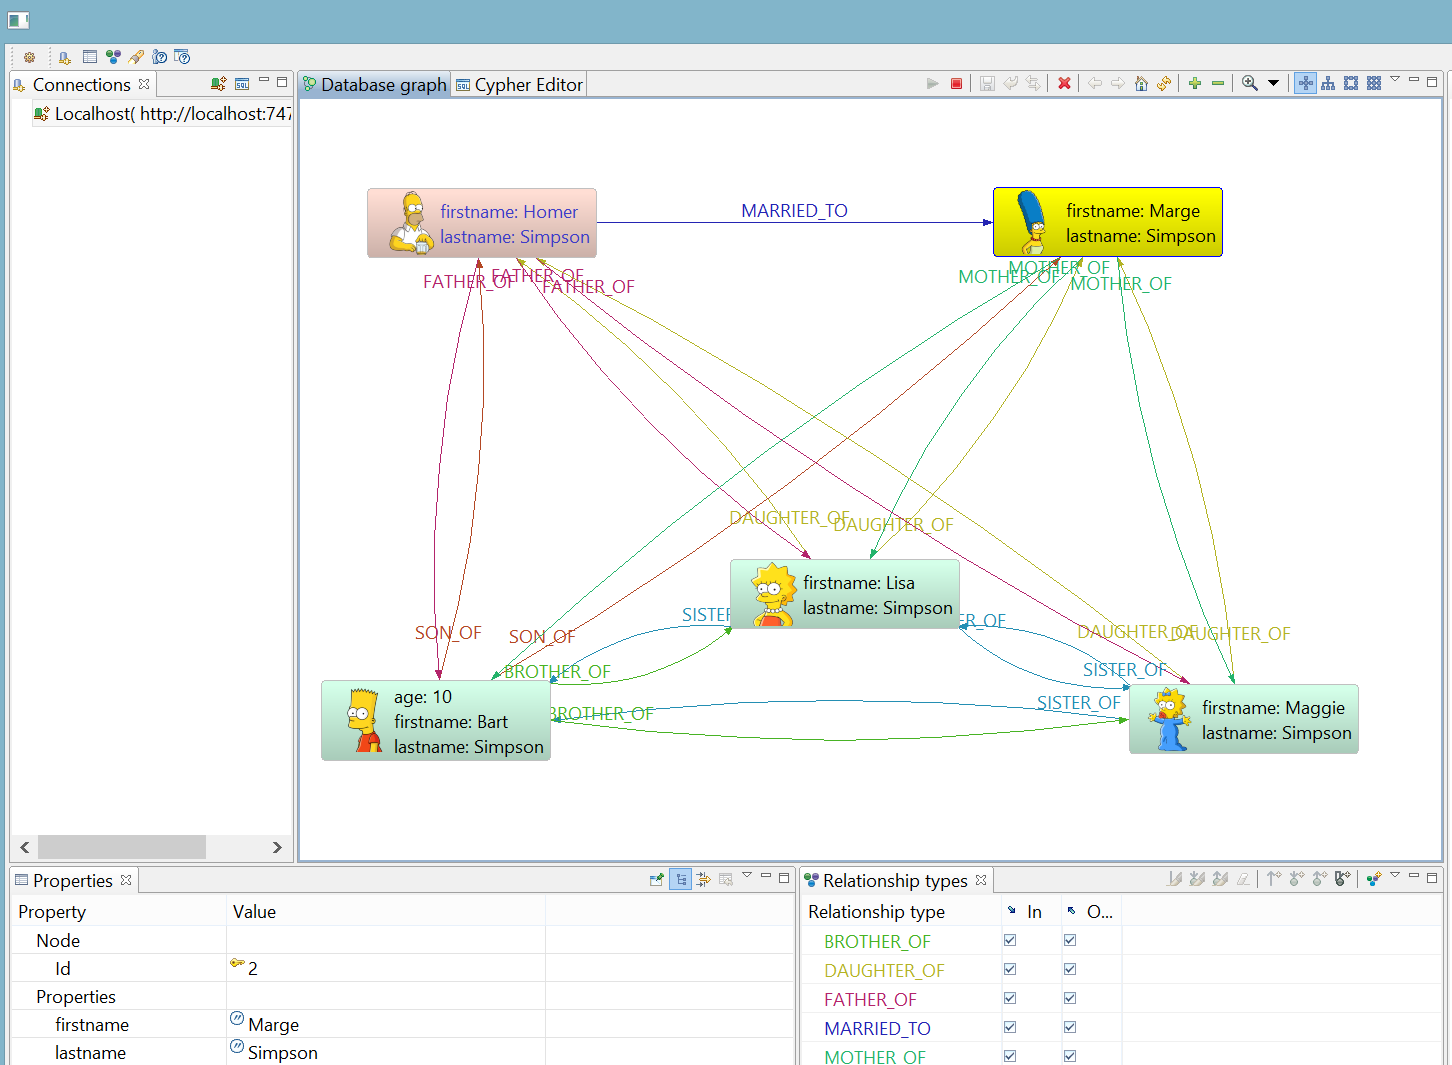
Note that the values that should match the filename is case-sensitive and you may need to reconnect to server to see the changes (refresh doesn’t cut it). I learned it the hard-way :-)
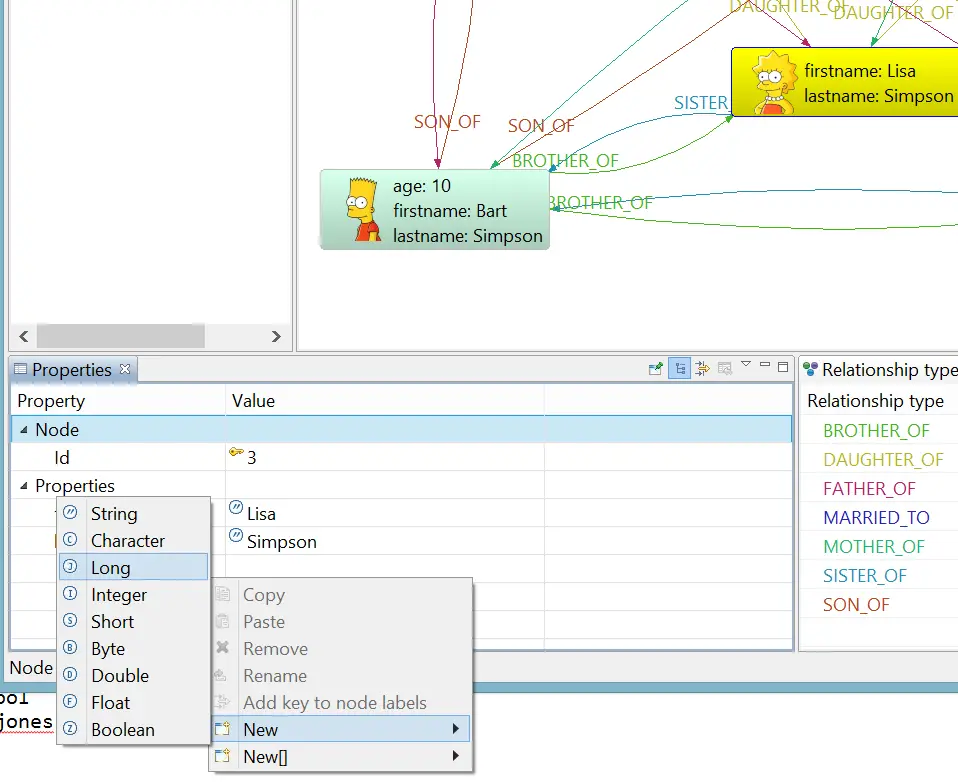
Managing the properties of a node is very easy. You can edit the current values in-place on the grid and add new values by right-clicking on the Properties grid and select New and type of the property.
It’s a nice tool for quickly editing data but it can easily be a memory-hog too! Once I noticed it was using 1.5GB RAM and the graph only around 100 nodes and relationships so I have some performance concerns about it with large datasets.
Gephi
Gephi is a general visualisation tool and thanks to its plugin support it could be extended to support Neo4J databases. (You need at least JDK 7 to install the plugin.)
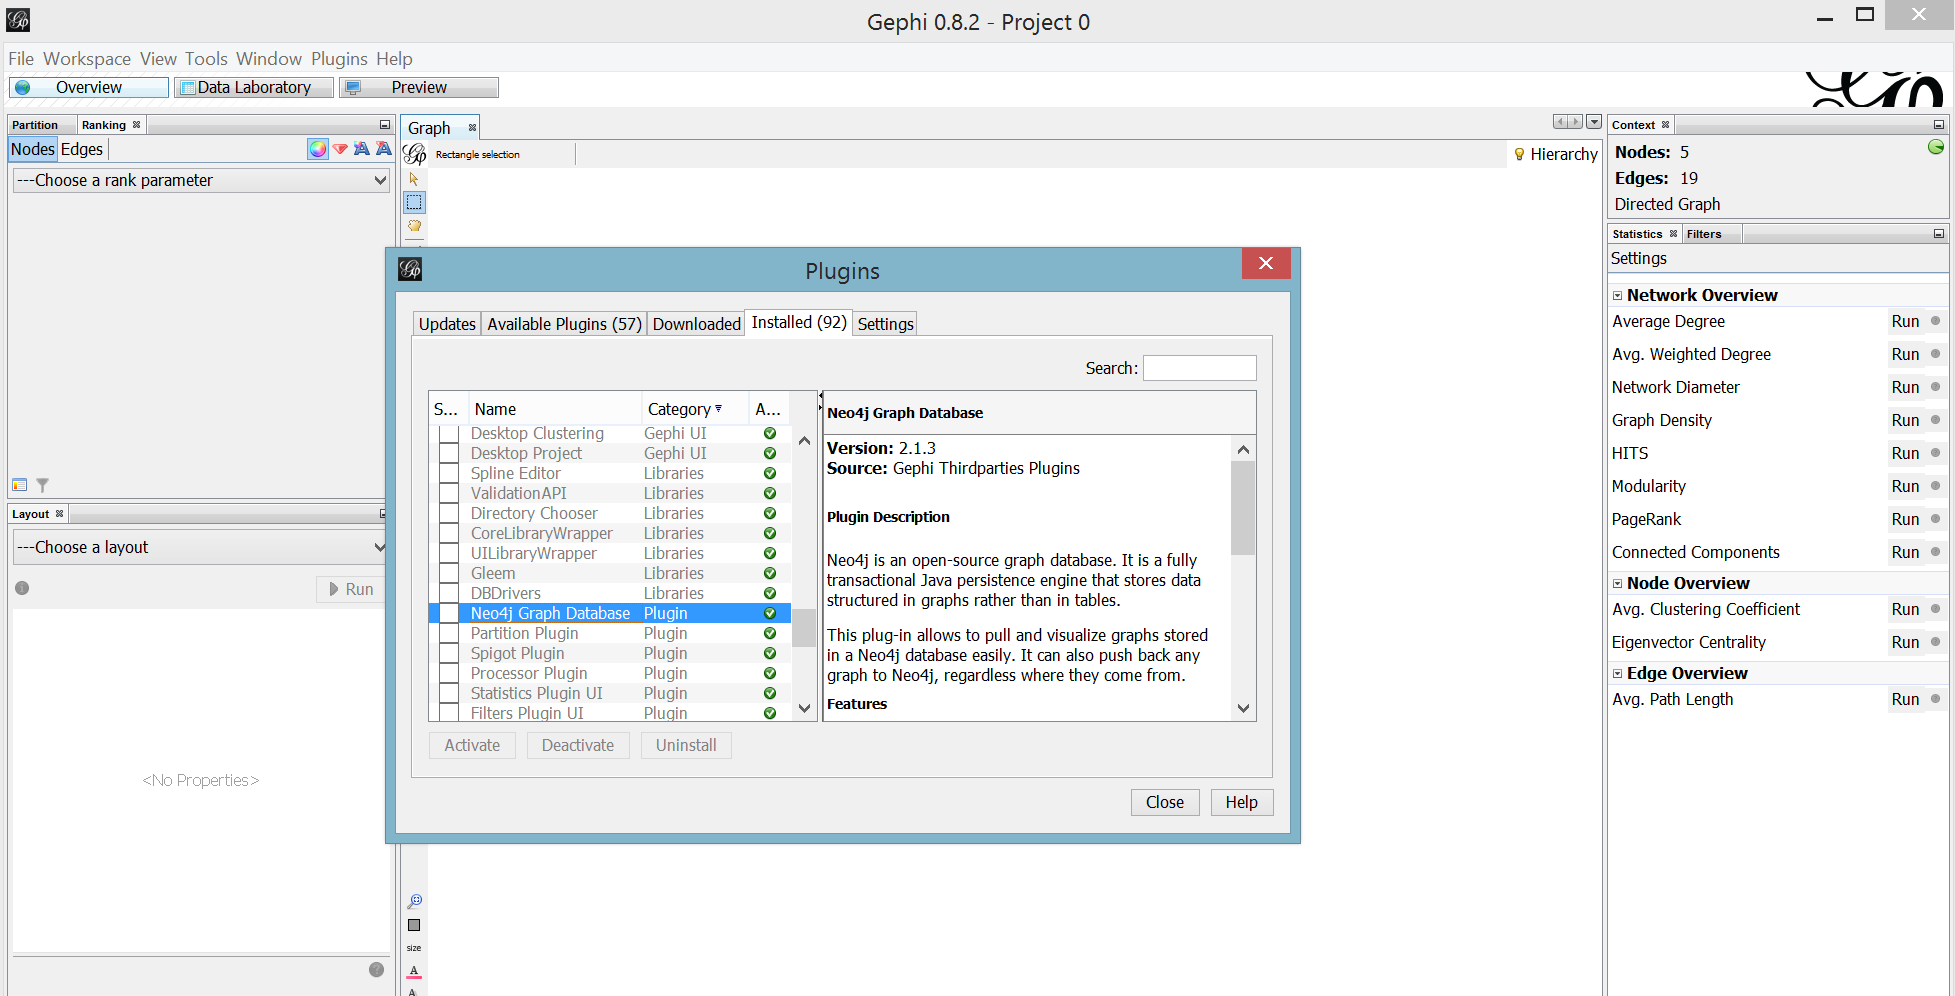
You can download and install the Neo4J plugin manually or better yet you can just select Tools -> Plugins -> Available Plugins and search Neo4J.
Once installed you can then import a Neo4J database by selecting File -> Neo4J Database -> Full Import
Make sure to shutdown the Neo4J server before the import or you will get this very informative error message from Gephi:
Apparently it locks the database as well so if you try to run Neo4J again while Gephi is still running you get this error:
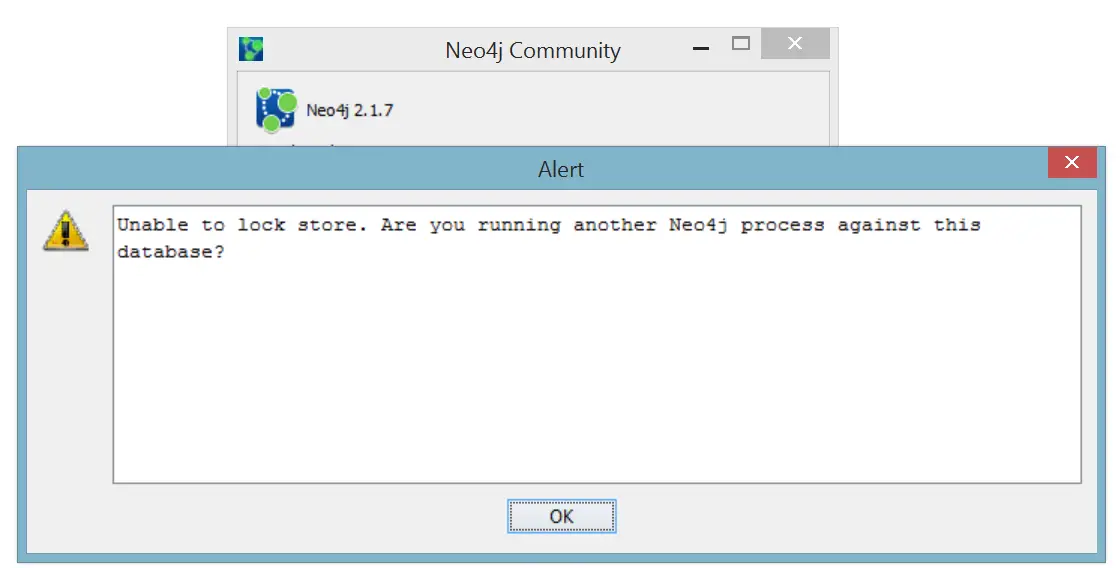
Clearly they don’t play well together so it’s best to run them separately.
After the import you can view the graph visually like this
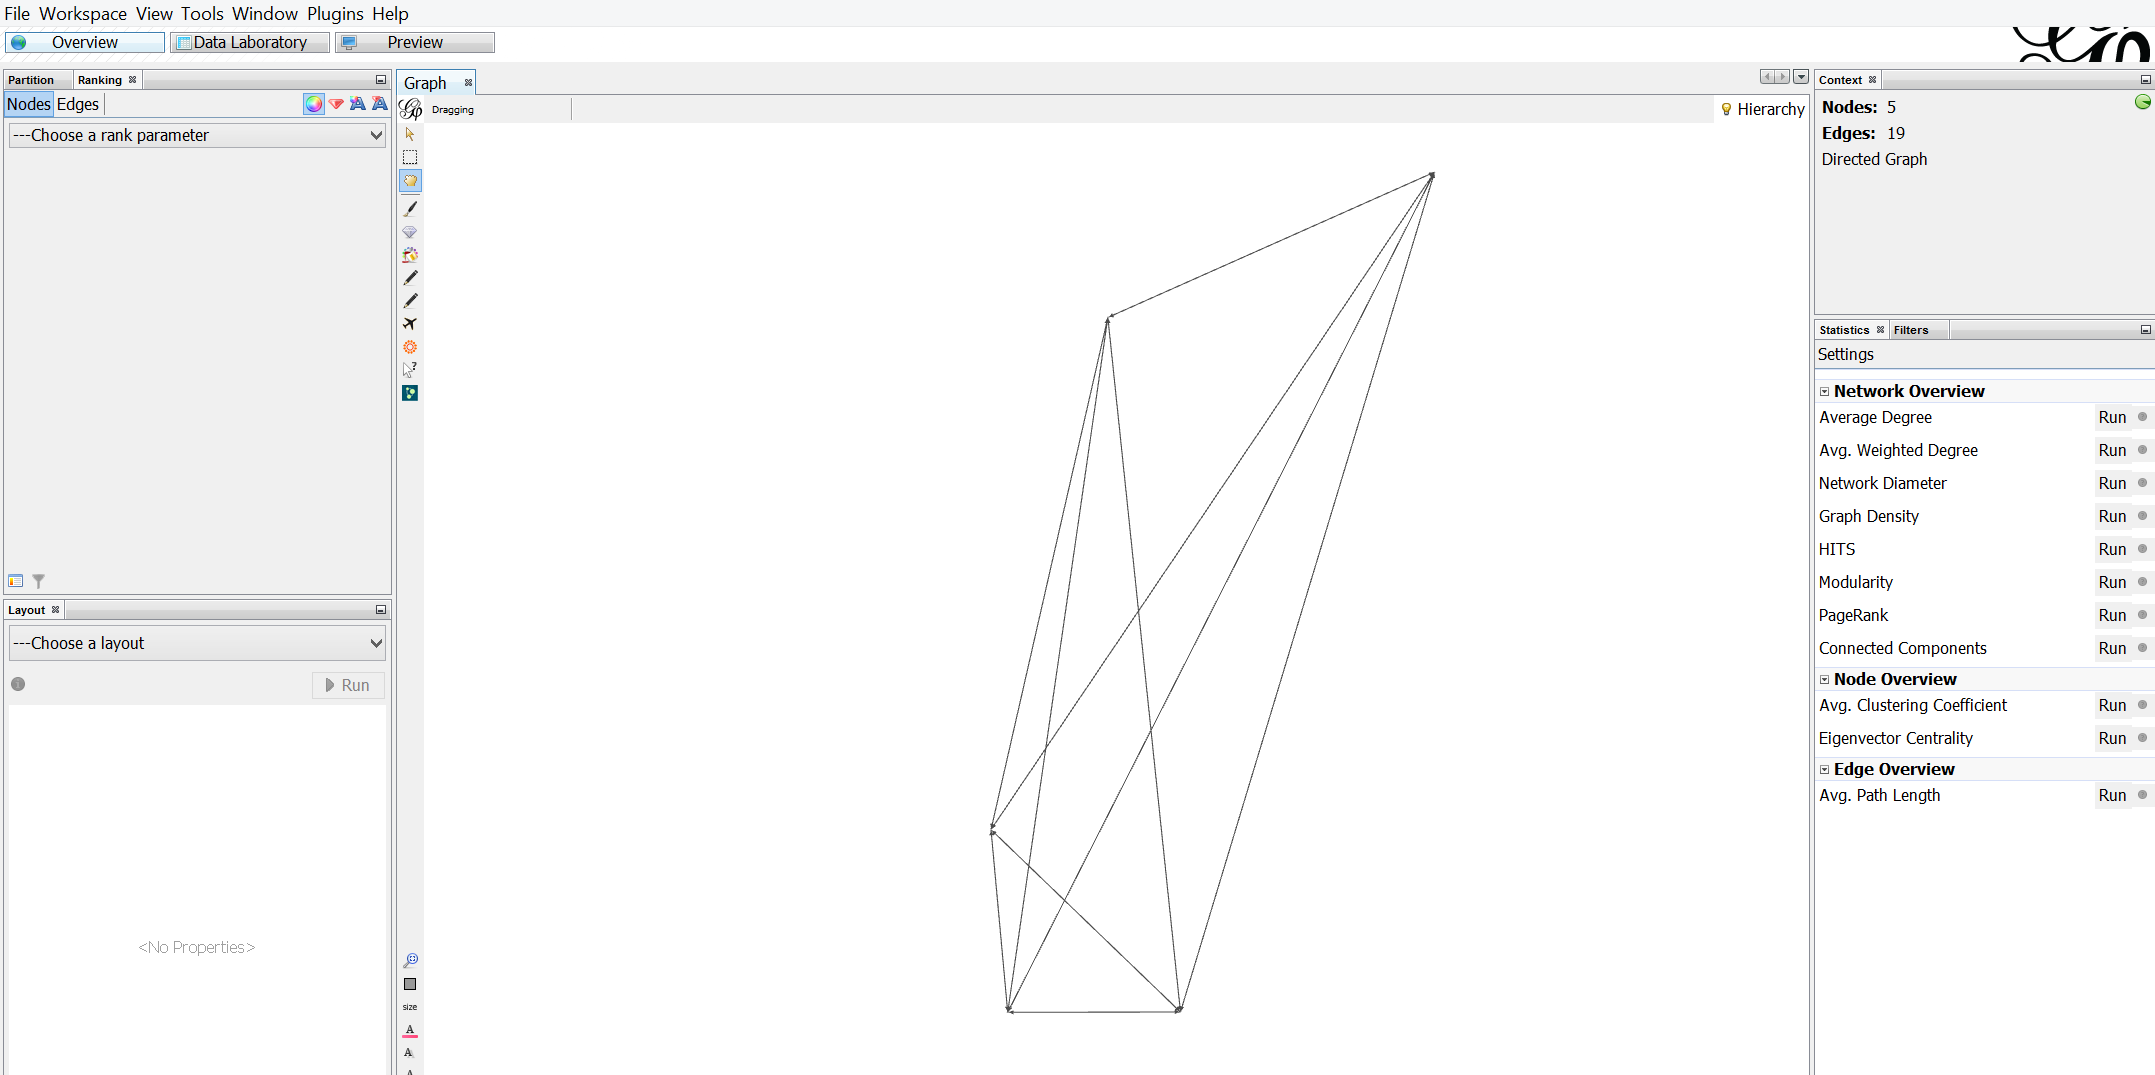
Doesn’t look as impressive as Neoclipse IMHO!
To view the data you can switch to Data Laboratory tab:
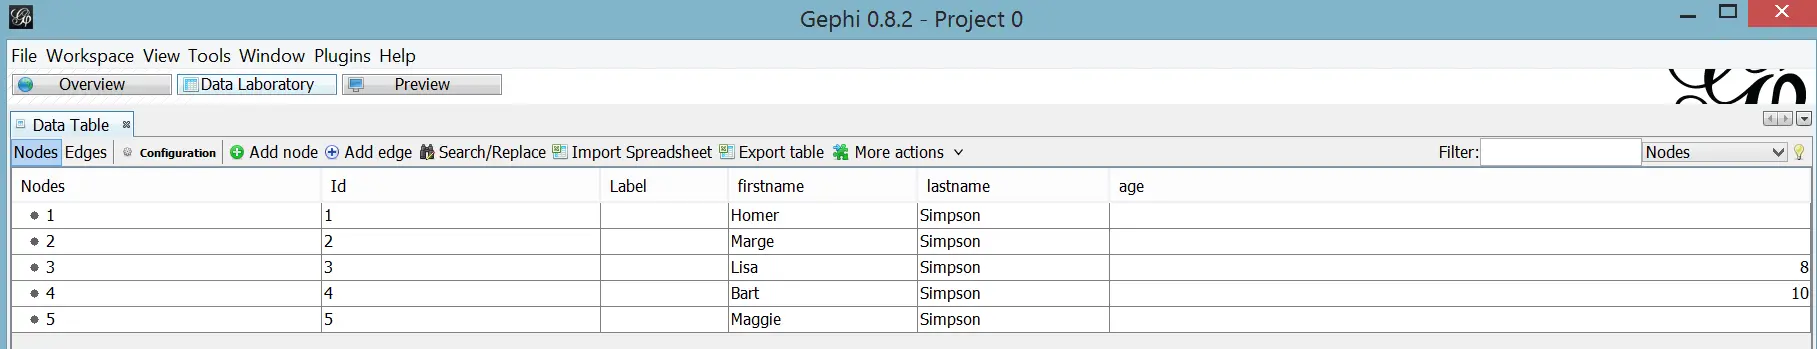
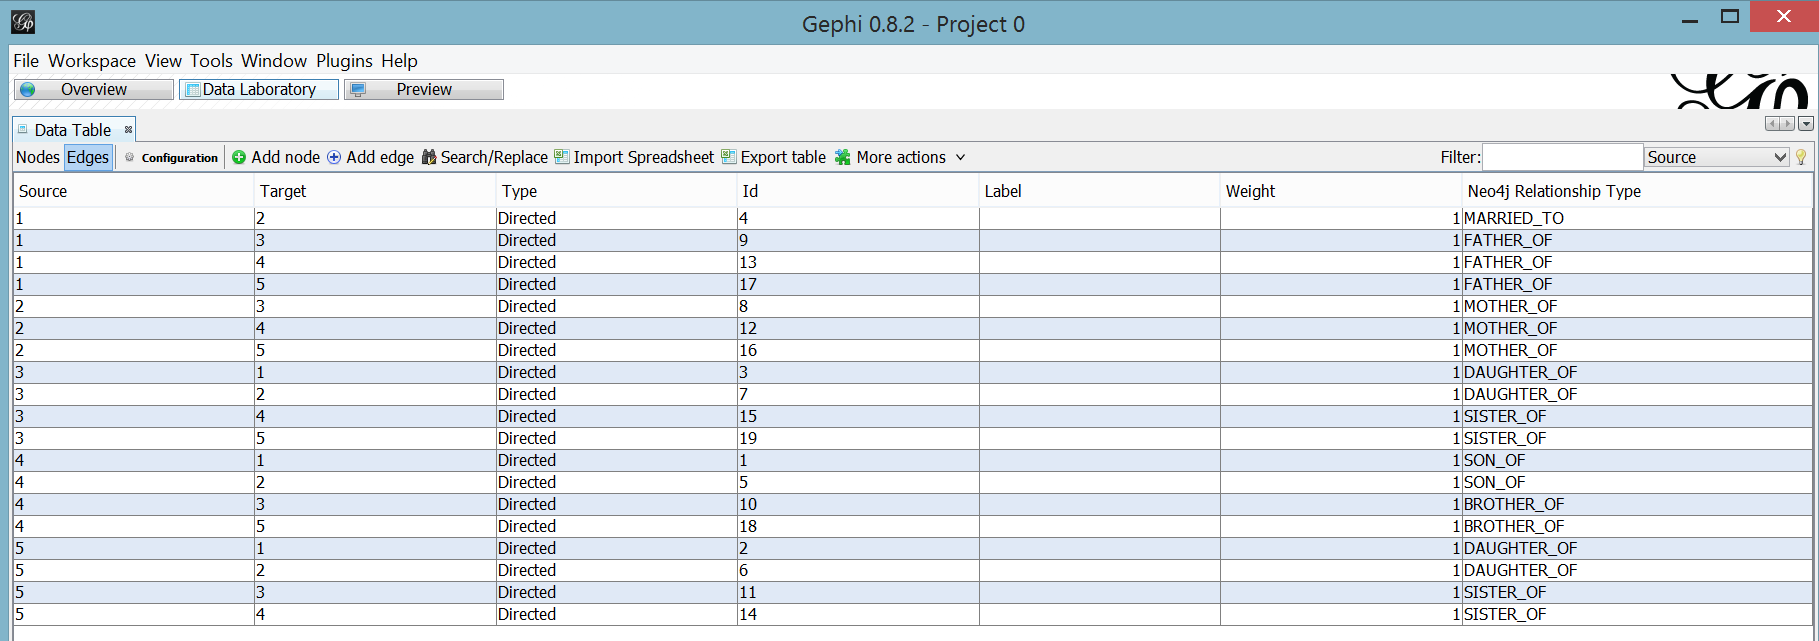
In theory you can add nodes and export the database but that wasn’t a very successful endeavour for me. When you add a new node you can set the label but you cannot edit any properties.
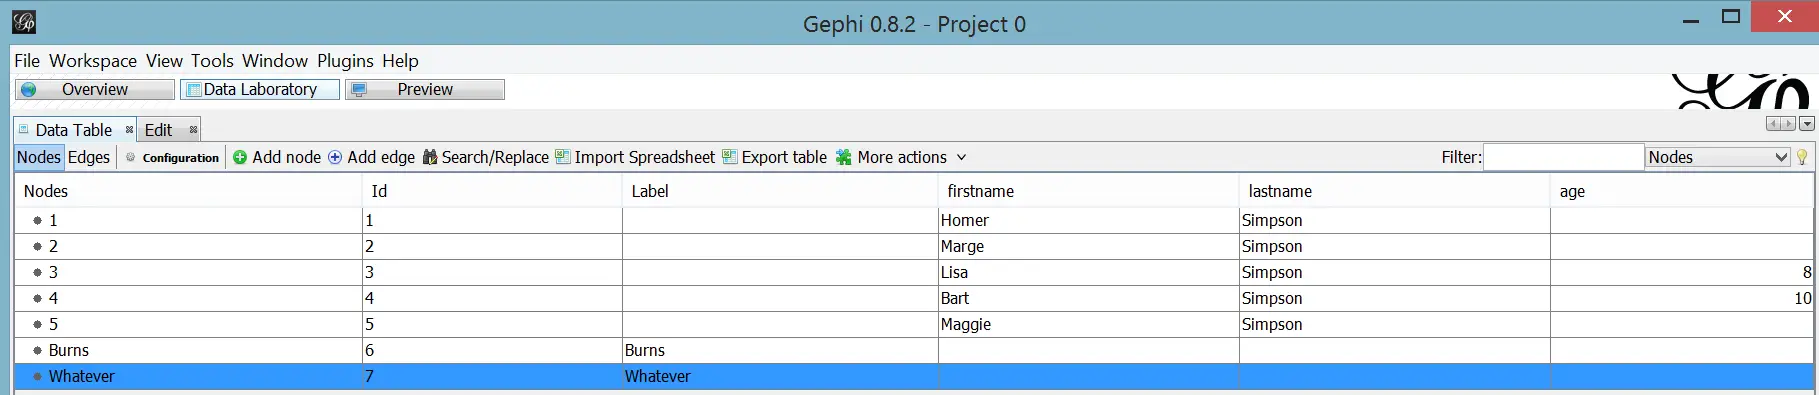
So that wasn’t quite helpful. I don’t know what you can do with a graph without any properties.
Gephi is still in beta phase. Also as plugins are developed by third-parties there might be some inconsistencies sometimes. I’ll leave this tool for the moment but it looks promising so I’ll put a pin to it for the time being.
Tom Sawyer Perspectives
This is also a generic visualisation tools that can work with multiple data sources. It can integrate with Neo4J as well as InfiniteGraph, a distributed graph database.
Downloading the trial software is a bit tricky. First you apply for an account. Your application is processed manually. After you are accepted, you first apply for a code to evaluate the product. Luckily it’s handled automatically and you receive the code right away. You then enter the code to have the privilege(!) to submit another form that details what type of project you’re planning to develop, what programming language you are using etc. That application is also processed manually. Currently I’m still waiting to be granted a trial license so I will not review the software for the time being. If I get to try it someday I will update this post.
Comparison
| Tool | Price | Requirements | Pros | Cons |
|---|---|---|---|---|
| Neo4J Browser | Free | Web browser | <ul><li>Comes with the server</li><li>Rich feature set</li></ul> | <ul><li>No editing visually</li></ul> |
| Linkurious | €249 | Web browser | <ul><li>Visual editing</li></ul> | <ul><li> Expensive </li></ul> |
| Neoclipse | Free / Open Source | Java 1.6 | <ul><li>Easy to use and edit data</li><li>Nice decoration options</li></ul> | <ul><li>High memory usage</li><li>Glitches may cause disruption</li></ul> |
Prototyping tools
My main goal in this quest was to find a tool that would allow me to edit data visually to speed up data entry. Apart from tools that can directly manipulate data there are also a bunch of modelling tools. I won’t cover them in depth in this post but might be helpful to have a short list of them at least so that to give some pointers.
OmniGraffle
OmniGraffle is a general purpose diagramming tool. It’s not free nor cheap but it has an iPad version so you can keep modelling on-the-go!
Arrow Tool
Arrow Tool is an open-source project developed by a Neo4J developer. It’s as simple as it gets and helps you to quickly create a model.
Conclusion
This is by no means an exhaustive list of the tools in the market. As graph databases gain more traction the number of such tools will exponentially increase.
Visual tools help a great deal sometimes to make sense of and see how the data is connected. But you need to have good Cypher skills to be able to run complex queries. In the next post I’ll go over Cypher and cover the basics.