Load it up with JMeter (Part 1 – Basics)
One of the key goals when developing a web application is to make it scalable. Meaning that it should handle lots of traffic without hindering the performance. But most of the time we only care about performance when it becomes a problem and generally it’s then too late to make radical design changes. Therefore, an upfront automated load testing is very helpful to gauge your application’s performance and being aware of its limits. One popular tool used for load testing is JMeter.
JMeter Basics
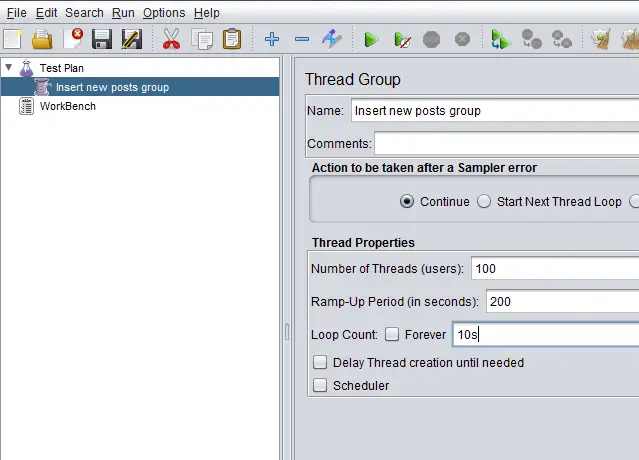
- Thread Group: Each thread acts like a single user. All elements must be under a thread group.
- Listener: Allows access to the information gathered by JMeter. Some listener examples are Aggregate Report, Graph Report and Summary Report
- Logical Controller: They allow you to add construct to control the flow of your tests such as If, While, ForEach
- Sampler: They tell jMeter to send requests to server and wait for a response.
When you launch JMeter there are 2 items on the left menu: Test Plan and Workbench. Test Plan is the real deal. That is the actual sequence of events that are fired. Workbench is where you can store test elements.
Creating a load test plan can be accomplished in 2 simple steps:
-
Create a thread group: Everything runs under a thread group. Think of each thread as a user.
-
Insert an HTTP request: Set the host name and page you want to call.
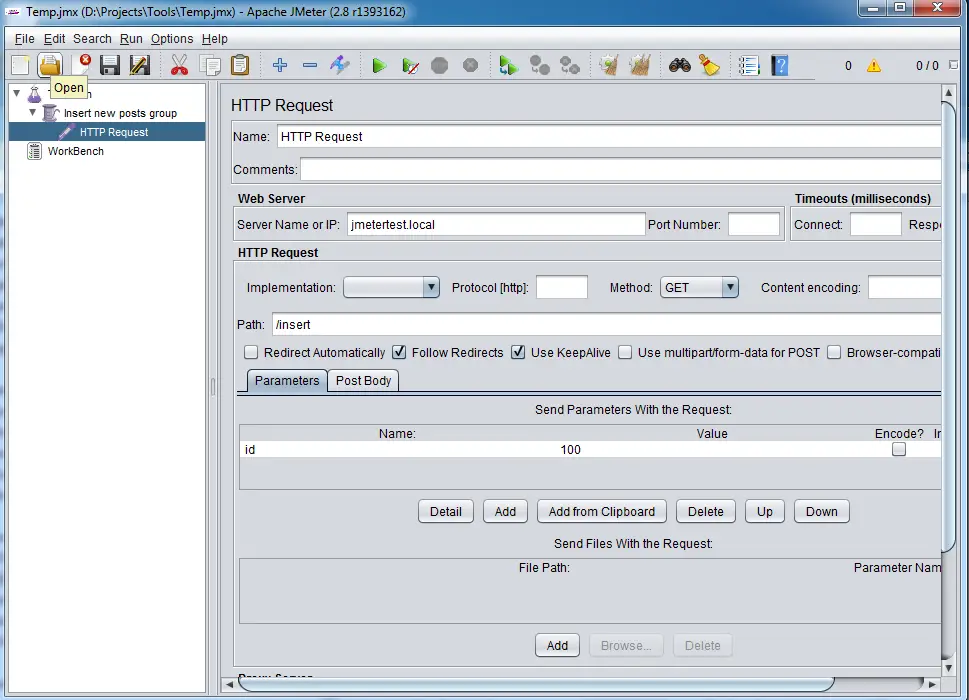
That’s it! If all you need is to create some heavy load you can create a few different HTTP requests and start bombarding your server right away.
A trivia about the JMeter is that it is mentioned in the book titled “We Are Anonymous”. Apparently it can also be used as a DDoS tool!